A closer look at hard drives
Disco Mania
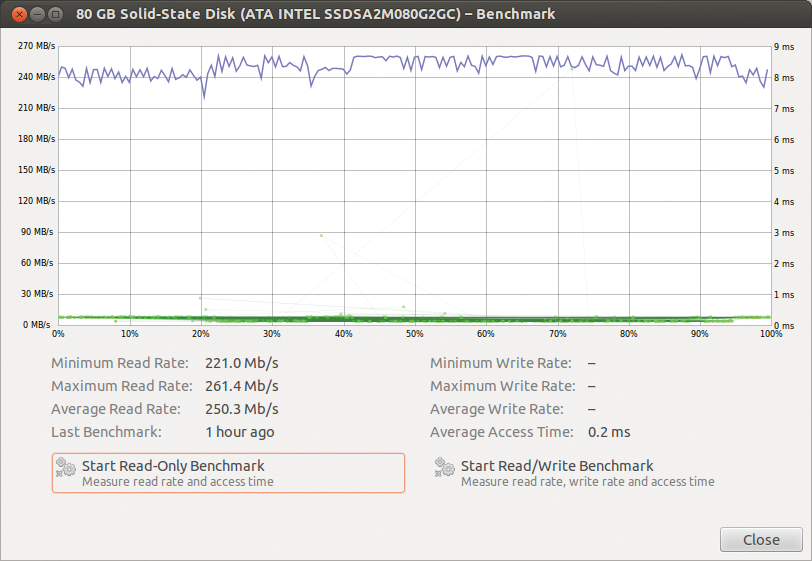
In the previous issue, I set down some history and the basic hard drive layout and operation background as a prelude to fully diving into the subject in this second part of my series. Resuming from where I left off, I'll try find out everything that my laptop knows about its internal drive (Figure 1).

I have an 80GB Intel 320 SSD, performing remarkably close to its specified sequential read rating of 270MBps [1], but it is the second-generation drive's write performance that demonstrates the significant benefits of the TRIM [2] extension, enabling an SSD to distinguish a true overwrite operation from a write onto unallocated free space. Because a drive's logic has no insight into filesystem structure, these two operations were previously indistinguishable, needlessly degrading SSD write performance. The TRIM option enables the filesystem to notify disks of file deletions – resolving this problem in most configurations not involving RAID, which is still negatively affected.
The /etc/fstab file shows that this partition is installed with Ubuntu 12.04's default ext4 filesystem, which is indeed capable of issuing TRIM messages to the disk. But, had I not studied Intel's spec sheets, how would I know that the disk can make use of such functionality?
The hdparm [3] tool exposes all the disk's details to the administrator's prying eye. From the output presented in Listing 1, you can determine that this is indeed a solid state device (line 25), supporting SATA 2 (line 62) but not SATA 3 (Gen 3 signaling is not listed), supporting the TRIM (line 67) and SMART (line 37) extensions. Hdparm provides access to settable parameters as well, and makes it rather easy to corrupt or even delete a filesystem. A useful example is the secure erase extension enumerated at line 77, which is not even the most dangerous of all available options, so thread very carefully.
Listing 1: Output of hdparm -I /dev/sda on an Intel 320 SSD
1  /dev/sda:
2
3  ATA device, with non-removable media
4          Model Number:       INTEL SSDSA2M080G2GC
5          Serial Number:      XXXXXXXXXXXXXXXXXX
6          Firmware Revision:  2CV102HD
7          Transport:          Serial, ATA8-AST, SATA 1.0a, SATA II Extensions, SATA Rev 2.5, SATA Rev 2.6
8  Standards:
9          Used: ATA/ATAPI-7 T13 1532D revision 1
10          Supported: 7 6 5 4
11  Configuration:
12          Logical         max     current
13          cylinders       16383   16383
14          heads           16      16
15          sectors/track   63      63
16          --
17          CHS current addressable sectors:   16514064
18          LBA    user addressable sectors:  156301488
19          LBA48  user addressable sectors:  156301488
20          Logical  Sector size:                   512 bytes
21          Physical Sector size:                   512 bytes
22          device size with M = 1024*1024:       76319 MBytes
23          device size with M = 1000*1000:       80026 MBytes (80 GB)
24          cache/buffer size  = unknown
25          Nominal Media Rotation Rate: Solid State Device
26  Capabilities:
27          LBA, IORDY(can be disabled)
28          Queue depth: 32
29          Standby timer values: spec'd by Standard, no device specific minimum
30          R/W multiple sector transfer: Max = 16  Current = 1
31          DMA: mdma0 mdma1 mdma2 udma0 udma1 udma2 udma3 udma4 udma5 *udma6
32               Cycle time: min=120ns recommended=120ns
33          PIO: pio0 pio1 pio2 pio3 pio4
34               Cycle time: no flow control=120ns IORDY flow control=120ns
35  Commands/features:
36          Enabled Supported:
37             *    SMART feature set
38                  Security Mode feature set
39             *    Power Management feature set
40             *    Write cache
41             *    Look-ahead
42             *    Host Protected Area feature set
43             *    WRITE_BUFFER command
44             *    READ_BUFFER command
45             *    NOP cmd
46             *    DOWNLOAD_MICROCODE
47                  SET_MAX security extension
48             *    48-bit Address feature set
49             *    Device Configuration Overlay feature set
50             *    Mandatory FLUSH_CACHE
51             *    FLUSH_CACHE_EXT
52             *    SMART error logging
53             *    SMART self-test
54             *    General Purpose Logging feature set
55             *    WRITE_{DMA|MULTIPLE}_FUA_EXT
56             *    64-bit World wide name
57             *    IDLE_IMMEDIATE with UNLOAD
58             *    WRITE_UNCORRECTABLE_EXT command
59             *    {READ,WRITE}_DMA_EXT_GPL commands
60             *    Segmented DOWNLOAD_MICROCODE
61             *    Gen1 signaling speed (1.5Gb/s)
62             *    Gen2 signaling speed (3.0Gb/s)
63             *    Native Command Queueing (NCQ)
64             *    Phy event counters
65                  Device-initiated interface power management
66             *    Software settings preservation
67             *    Data Set Management TRIM supported (limit 8 blocks)
68             *    Deterministic read ZEROs after TRIM
69  Security:
70          Master password revision code = 65534
71                  supported
72          not     enabled
73          not     locked
74          not     frozen
75          not     expired: security count
76                  supported: enhanced erase
77          2min for SECURITY ERASE UNIT. 2min for ENHANCED SECURITY ERASE UNIT.
78  Logical Unit WWN Device Identifier: 500151795934ceda
79          NAA             : 5
80          IEEE OUI        : 001517
81          Unique ID       : 95934ceda
82  Checksum: correct
Hdparm includes a simple benchmark, which you can use to compare cached [4] and raw disk performance on a simple level:
$ hdparm -t /dev/sda
/dev/sda:
  Timing buffered disk reads: 616 MB in
  3.00 seconds = 205.03 MB/sec
$ hdparm -T /dev/sda
/dev/sda:
  Timing cached reads: 6292 MB in
  2.00 seconds = 3153.09 MB/sec
If this were a spinning disk, you would also be able to verify the performance degradation of ZCAV encoding [5] with the --offset option, but an SSD will exhibit similar timings regardless of where the disk is tested.
The other tool that can be relied upon to examine a disk's status is smartctl, which provides access to a drive's Self-Monitoring, Analysis, and Reporting Technology (SMART) [6] metrics. Many people have remained skeptical about the actual predictive ability of SMART data, despite a study of more than 100,000 disks at Google [7]. Yet, Reallocated Sector Count (Table 1, attribute 5) remains a key monitoring metric of both solid state and rotational storage media. Table 1 shows all attributes available for my drive – bear in mind that the selection of attributes is different between vendors and changes with storage technology.
Tabelle 1: SMART Attributes Tracked by an Intel 320 SSD
|
ID |
Attribute Name |
Hex Flag |
Value |
Worst |
Threshold |
Type |
Updated |
When Failed |
Raw Value |
|---|---|---|---|---|---|---|---|---|---|
|
3 |
Spin_Up_Time |
0x0020 |
100 |
100 |
000 |
Old_age |
Offline |
– |
0 |
|
4 |
Start_Stop_Count |
0x0030 |
100 |
100 |
000 |
Old_age |
Offline |
– |
0 |
|
5 |
Reallocated_Sector_Ct |
0x0032 |
100 |
100 |
000 |
Old_age |
Always |
– |
0 |
|
9 |
Power_On_Hours |
0x0032 |
100 |
100 |
000 |
Old_age |
Always |
– |
2456 |
|
12 |
Power_Cycle_Count |
0x0032 |
100 |
100 |
000 |
Old_age |
Always |
– |
501 |
|
192 |
Unsafe_Shutdown_Count |
0x0032 |
100 |
100 |
000 |
Old_age |
Always |
– |
40 |
|
225 |
Host_Writes_32MiB |
0x0030 |
200 |
200 |
000 |
Old_age |
Offline |
– |
17343 |
|
226 |
Workld_Media_Wear_Indic |
0x0032 |
100 |
100 |
000 |
Old_age |
Always |
– |
715 |
|
227 |
Workld_Host_Reads_Perc |
0x0032 |
100 |
100 |
000 |
Old_age |
Always |
– |
0 |
|
228 |
Workload_Minutes |
0x0032 |
100 |
100 |
000 |
Old_age |
Always |
– |
4278402805 |
|
232 |
Available_Reservd_Space |
0x0033 |
100 |
100 |
010 |
Pre-fail |
Always |
– |
0 |
|
233 |
Media_Wearout_Indicator |
0x0032 |
099 |
099 |
000 |
Old_age |
Always |
– |
0 |
|
184 |
End-to-End_Error |
0x0033 |
100 |
100 |
099 |
Pre-fail |
Always |
– |
0 |
ioping [8] is a most convenient simple I/O benchmark, and it's my new favorite way to monitor disk latency in real time:
4096 bytes from /dev/sda (device 74.5 Gb): request=1 time=0.1 ms
4096 bytes from /dev/sda (device 74.5 Gb): request=2 time=0.2 ms
4096 bytes from /dev/sda (device 74.5 Gb): request=3 time=0.2 ms
...
The ioping utility can target a device, a directory, or a file if appropriate. You can generate a disk load through stress [9] or by compiling a kernel and watching the results on your system's I/O latency.
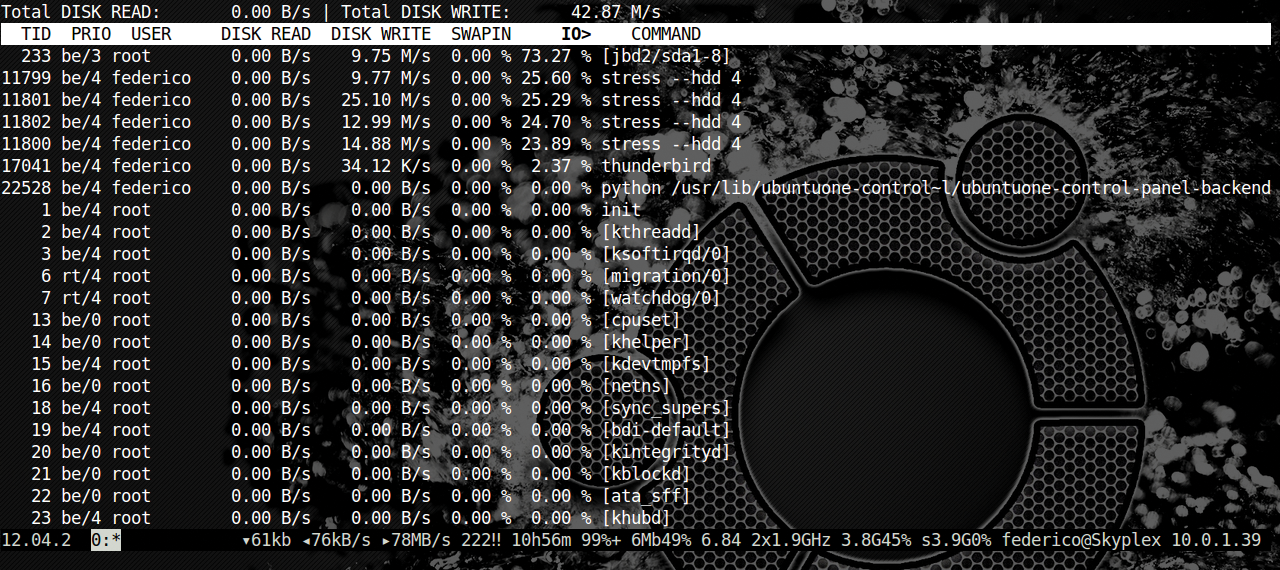
A broader system-wide view is produced by iotop [10], which provides a hierarchical ranking of I/O bandwidth usage by process (or thread) as consumed during the sampling interval. Figure 2 shows an artificial load's impact on the system write performance. Because kernel 2.6.13 introduced the CFQ scheduler, the Linux kernel has allowed the setting of a process's I/O class and priority (the "PRIO" field in iotop's listing), which can be tuned through the ionice [11] command.

stress --hdd 4 on disk writes.Classes include the lower priority "idle" class, which receives disk access only as no other requests are pending, as well as the default "best effort" class. The high-priority "real time" class must be used with care, because its unconditionally immediate disk access may easily starve other I/O processe. A finer-grained priority level between 0 (highest) and 7 (lowest) can be further set for classes other than idle, and it is a safer option in most cases.
